Understanding the results table view
This article was written to explain the INCRMNTAL results table view, and how to use it.
The INCRMNTAL table view allows you to view your measurements’ results in parallel, and in an adjustable, lightning fast view.
This table view was designed to view several results in parallel and compare their outcomes within the platform, making it possible to take a higher look at your measurements’ results, and produce actionable insights more easily.
You can switch to this view by clicking the table icon on your results tab.
Filters:
Your table view will change as you set your filters. Those will present the measurements that match them, and include the following parameters:
- Timeframe - In what dates were the measurements run
- Application - Based on the ones integrated in the dashboard
- Platform
- Channel
- A free text search
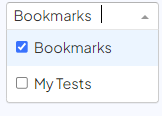
It is also possible to check the Bookmarks / My Tests boxes.

Dimensions:
Then, in the dropdown below, it is possible to choose the columns you’d like to see, based on the incrementality measurements’ results and your attribution data. The following dimensions are available:
- Mediasource
- Channel
- Campaign
- Ad Group
- Activity
- Type
- Platforms
- Country
- Activity Date
- Spend Before
- Spend After
- Spend Delta
- Attributed Conversions Before
- Attributed Conversions After
- Attributed Conversions Delta
- Revenue Before
- Revenue After
- Revenue Delta
- Revenue Indication Before
- Revenue Indication After
- Revenue Indication Delta
- Attributed Engagement Before
- Attributed Engagement After
- Attributed Engagement Delta
- Incremental Conversions
- Incremental Revenue
- Impact on Goal
- Cohort
Please see the below image as an example:
By clicking the download icon ( ), a CSV file will be generated and downloaded, based on the current view on the table view screen.
In case you’re missing a dimension you’d like to view in this table as well, don’t hesitate to suggest it on onboarding@incrmntal.com
For any question please contact support@incrmntal.com , or open a support Ticket here