What's the purpose of highlights?
Our platform is able to automatically measure and report the incremental value gained (or lost), given significant changes in your spend, app featuring, or manually added changes to the platform.. We've worked on an automated, curated process, where the platform automatically measures significant changes detected on your board, and our Analyst team chooses, reviews, and curates the highlights that are being sent to you, to ensure their compatibility to your current strategy and goal.
Methodology
Measurements are automatically run for your most significant changes in spend. In addition, measurements are selected based on previous highlights that were sent, as a follow up on changes that were previously flagged to the customer (e.g. when cohorts are developed, measurements will be rerun automatically).
Then, our Analysts reviews the measurements, deciding which ones (up to 8) should be sent to you on a weekly basis.
Later, each measurement gets a short explanation of the result, including a recommendation how to adjust the spend based on your strategy.
In addition, your highlights are sent with the relevant confidence interval set - Meaning, you can review the insights on High confidence interval (90%), should its spend be over 30% of the spend in OS and country, and Medium (50%) when an entity is above 80% of the spend in the market.
In case you've added goals to the platform, we'll consider the goals set on the platform as the main parameter for the sent highlights and recommendations. This is the best practice for your highlights recommendations. Read here how to set up goals.
In case you do not have a goal on your dashboard, we'll compare the result to the average CPI/CPA/ROAS in the measured market (country + OS).
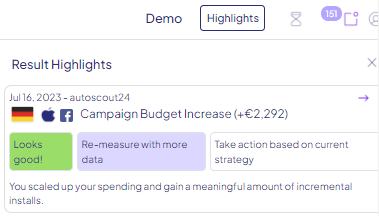
How to read the highlights recommendations and measurements?
For this, you can refer to the pages explaining the results page. Based on the defined goal and the known strategy of the client, the platform selects measurements that can be sent to you, following your needs from the platform and your strategy in your marketing operations.
Read here more about the results page.
How are highlights delivered?
There are 3 ways you can watch the highlights for your account:
- Dashboard - A tab will be automatically opened to your board, presenting the latest highlights send over the past week.
- Emails - Sent to your email, including a link to view the measurement itself

- Export to gSheet - Exported after sending the highlights via email, to allow you to slice and dice the data as you'd like and connect it to your internal data source.
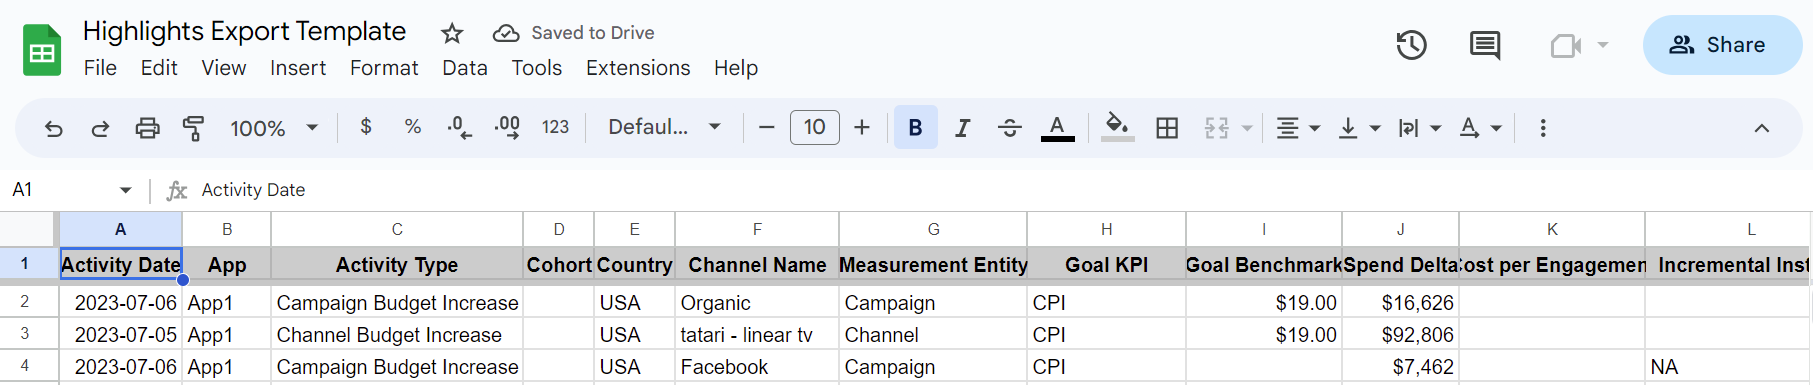
You can configure this export by discussing it with your dedicated CSM. Read more about its configuration here.
Recommendations
Based on your known strategy and goals, we'll curate recommendations for you regarding an entity's budget. In case your focus shifts to a specified network, geo, or platform, let your dedicated CSM know in order to adjust the highlights to focus on your requests.
You can read how to setup goals here.
Referring to your "market performance" in highlights refers to the performance in the measured country and OS (e.g. US/iOS).
Enabling highlights email
Only users on the dashboard are able to receive the highlights email.
To add a new user to the dashboard, read the following article.
To add an existing member on the dashboard to the highlights email, Admin users can access the Users tab in the Configuration screen, and enable the Highlight feature by switching the toggle: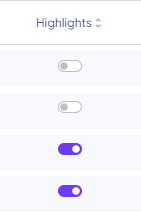
Unsubscribe
Contact your CSM to unsubscribe yourself from the Highlights email.
For any question please contact support@incrmntal.com , or open a support Ticket here