The measurements are the core of our platform, showing the impact of different changes in spend onto your performance. In this section, we explain how to interpret the result you see, and how to take decisions from it, based on your strategy.
The Header of the Result
The title of the result will indicate the change in spend we're measuring (from left to right):
- The activity date - the date in which the measured activity took place
- The platform / Operating System in which the activity was measured
- The entity (channel, campaign, or ad group) and its name
- The type of the change initially measured
- (when relevant) The available cohort/s of the activity (i.e. day 0 and day 7)
- (when relevant) The Goal set by the customer for the main KPI and Cohort
- The Incrementality Result of the main KPI (below - ROAS, 18.2% incrementality)
- The country/ies in which the activity took place
- The measure date - the date in which a user / system triggered the measurement.

The Confidence Level of the Result
To the left, and below the header, you'll see the adjustable confidence level of the result. This will define the confidence level we utilize for the prediction. By default, we utilize a Very High (95%) confidence level, i.e. only values that exceed or are below the 95% confidence interval will be considered incremental value. There are also the 90% confidence (High) and 50% confidence (medium). We do not recommend relying on measurements with 50% confidence.
The Change in Spend
The change in spend will be shown in 2 rows:
- The total summary, indicating the total spend before and after the change, in a period of up to 14 days before and after the change.
In case less than 14 days are available for this measurement, we'll indicate the number of days taken to the measurement in the summary:
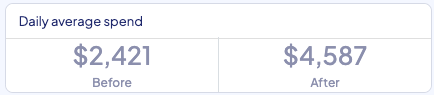
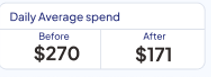
- The daily average spend is calculated as a simple average for the measurement days before and after the change, respectively.
The Incremental KPIs
The outcome of the measurement will be displayed as the incremental KPIs, by which you could understand the value of your spend change(s), and be able to make a decision and take the next action.
The total incremental value of all actions made within a certain entity over a period of two weeks, is calculated and indicated per KPI, based on the integrated KPIs in your account.
The presented values of CPI, CPA, or ROAS, for example, are calculated based the absolute values of all changes in spend (spend delta*), divided by the absolute values of the incremental value that was identified:
- incremental ROAS is calculated by [Incremental revenue] / [Spend Delta]
- incremental CPI is calculated by [Spend Delta] / [Incremental conversions]
- incremental CPA is calculated by [Spend Delta] / [Incremental Engagement]

If a Goal* per certain KPI has been set, this KPI will appear to first, compared to the set goal.


To understand the calculation of total incremental values, as well as spend delta calculation, please continue reading below.
*It is possible to define a goal based on any of the above metrics (CPI, CPA, ROAS), as well as define a custom calculation for a benchmark, indicating for each result whether the incremental value stands in your benchmark or not. Read here more about how to set up benchmarks.
Absolute values are being taken into both sides (spend and performance) of the incremental KPI calculations, to handle spend fluctuations that may occur during the measurement period. More about it below.
Understanding the Incremental Values:
Accumulated incremental values for calculated activities
In this section you can see the incremental values, gained or lost, due to a change you have made in spend.
In case there are multiple changes detected on the same entity you measured within the measurement timeframe of 14 days (i.e. several spend changes on a same channel or campaign, at a certain OS and Country), the result will include the incremental value of all the changes that happened within timeframe from the original change you measured.
The adjusted KPIs and incremental values are calculated based on the incrementality of all changes in the same entity, two weeks after the date of the measured change.
In the following example, the change in TikTok Channel / Saudi Arabia / iOS was measured on 24/2/2023. The result includes the impact of another change that happened within the following two - 2/3/2023. This is indicated under the Accumulated Incremental Values for Calculated Activities table.
The total Incremntal value row, displays the sum of all incrementality gained or lost, in absolute values, to account for the total incremental value of this entity on the measurement period.
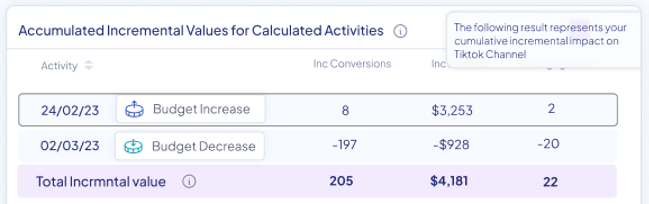
The value presented here is the value gained thanks to the budget increase in TikTok, and the value lost due to the budget decrease on 2/3/2023.
Spend delta for incrementality KPIs calculation, is being calculated as such:
The total sum of: daily spend of each day after the change, subtracted by the daily average spend of the period before the change, in absolute values.
The Attributed Market Data Table
When we refer to Market, we usually refer to a country and OS in which the change took place.
The attributed market data will reflect the data both on the entity level, and the country and OS level, for the measurement. The country and OS will be indicated at the top of the table.

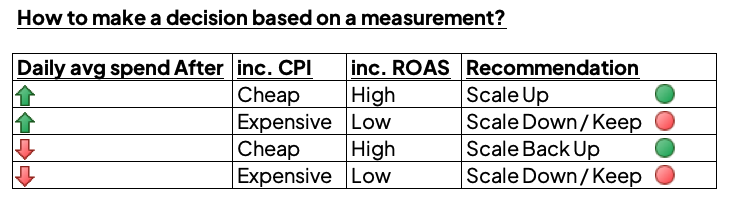
How to Make a Decision based on Incrementality Measurement?
- In case we see a low CPI/A or a high ROAS as a result of an increase/decrease in spend, we'd suggest increasing the spend of the measured entity
- In case we see a high CPI/A or a low ROAS as a result of an increase/decrease in budget, we'd advise to reduce or keep the current spend level of the measured entity.
- In case the result show little incrementality, we'd advise you to measure the same change at a later cohort (at least d7), or measure a later change to help you make a decision.
Additionally, you can read about it in this article, for more context on how to make decisions with an incrementality mindset.
External Links
To learn more on other parts of the results page, please see the following links:
- Understanding the Results Page - Advanced
- How Does the Model Allocate Credit for Changes Happening on the Same Day?