
This article explains how to make operational decisions based on measurements run on the board.
Measurement results can guide you to make changes in your spend, based on your defined goal (ROAS, CPI, CPA) and your strategy in your marketing activities. In order to understand how to make the best decision, and which parameters should be considered, keep reading below.We'd advise to read and be familiar with the results structure (simplified and advanced), as well as set up goals in your account, if you hadn't done so yet.
Look at the daily trend of spend
The change in daily spend will be summed in the result, and presented as the change in spend across the measurement's timeframe.
By viewing the daily spend you had before and after the change in spend, will help you determine the change in spend to do.
Let's take the following measurement, where we see an increase in spend from ~$150/day for this campaign, to be around $180-220/day (see the red line as spends for the measured entity). You can enable the spend of the measured entity under "data layers" in the prediction graph.
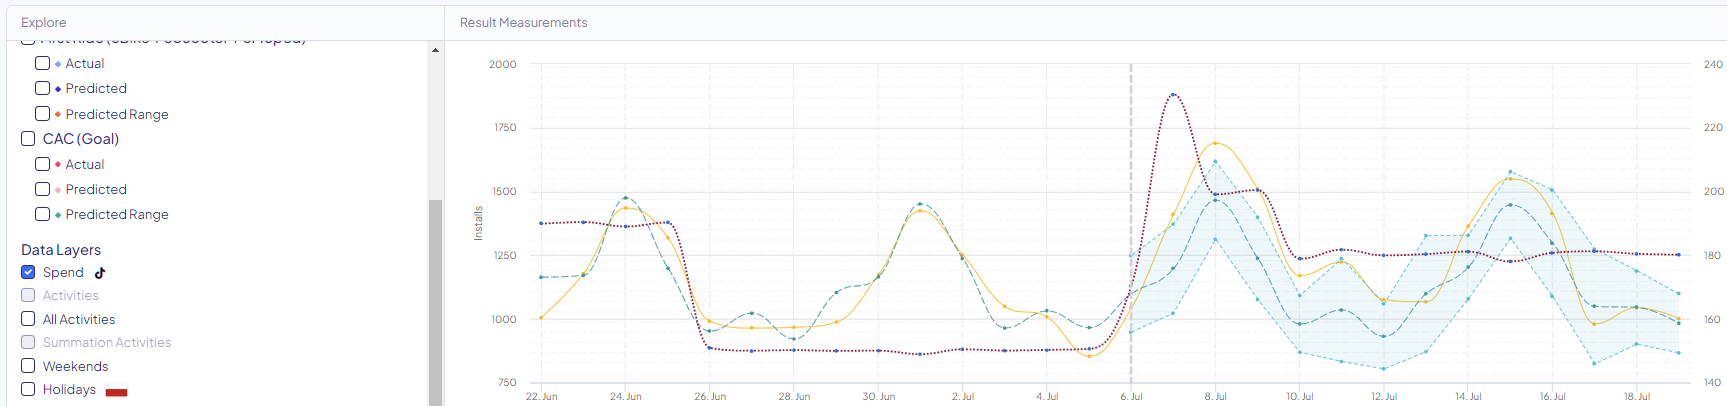
We can see correlations between the spend of the entity (red) and the lift in installs (yellow) - Which allows us to better validate the impact this increase had over your performance.
We can see in the measurement result, that the incremental value gained for installs is great, gaining the client a CPI of less than $1 - Great results!
The recommendation would be to scale up the spend of this campaign. As the daily spend was increased to ~$180 in the measured change, we can scale up our daily spend to be even higher.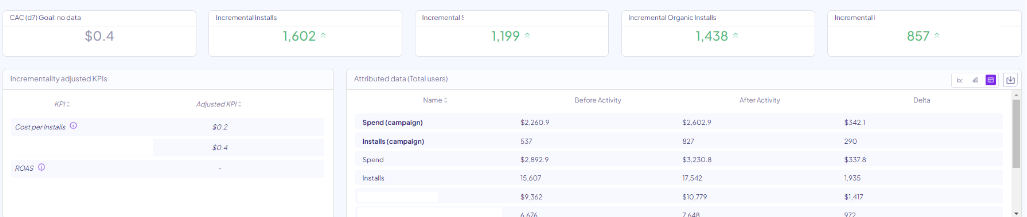
Look at multiple measurements of the same entity, across different times and (if available) cohorts
The more measurements you have on a single entity across time, the better your understanding will be of the next recommended budget change. We especially recommend exporting your measurements, and analyze the incremental value based on several measurements at the same time.
For instance, the following measurements show two increases in this campaign's spend. One of them, showing great incrementality, the other one shows less incremental value than the previous increase.
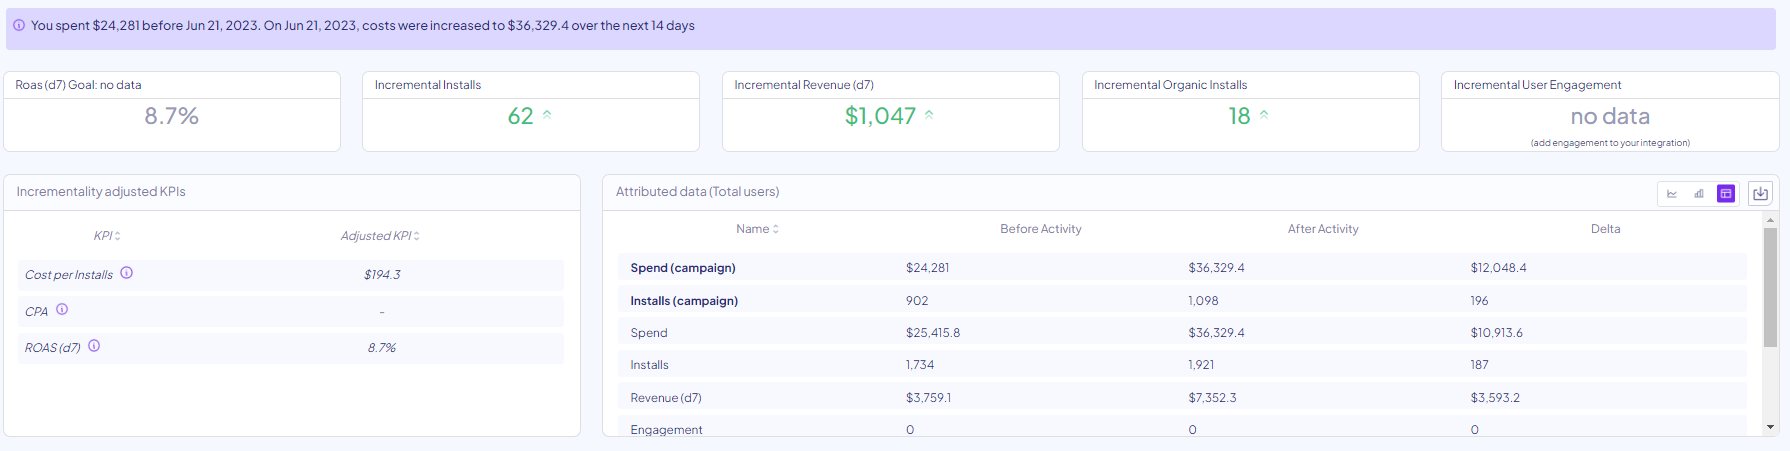
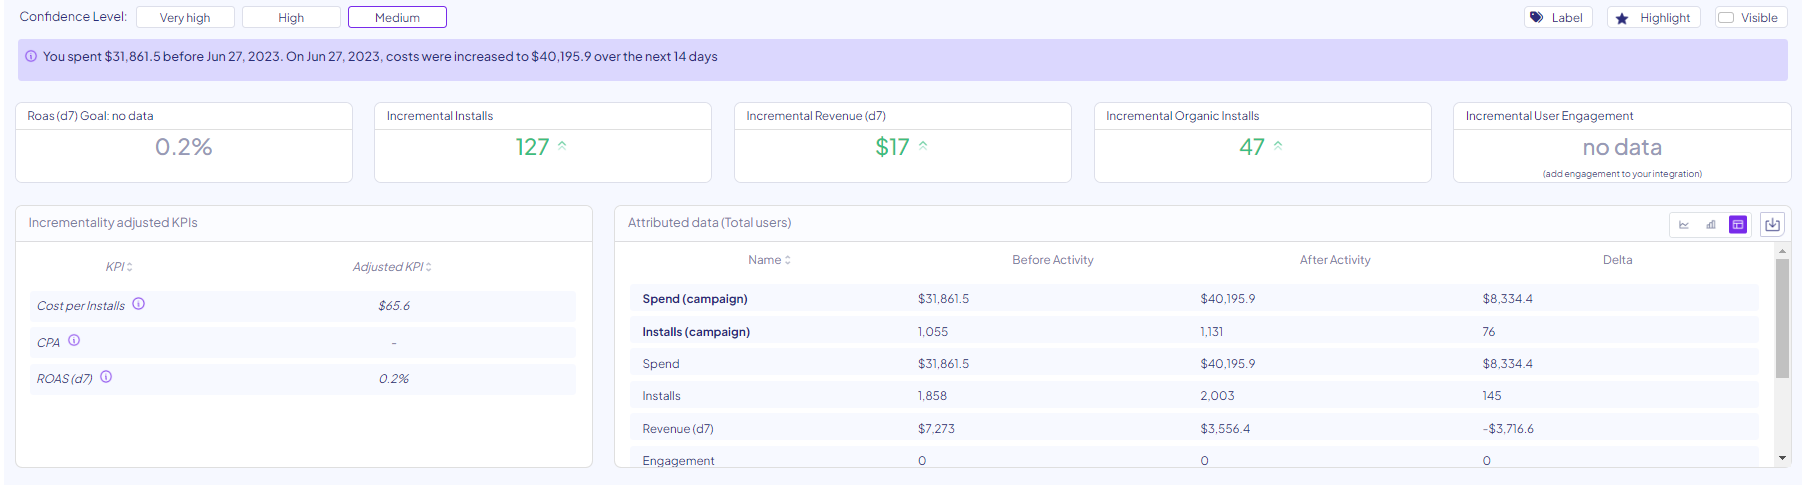
This would suggest a diminishing returns effect, where optimal value was gained with the previous increase in spend we had. The suggestion in this case, would be to scale down spends to the previous level we had.
The incrementality of your revenue, for instance, on different cohorts, can tell you more on the impact of certain changes in a campaign across different cohorts. Should you be focused on optimizing a specific cohorts, you can consider measurements on this cohort.
As incrementality is very relative, we'd suggest looking at changes on the same entity in the passing month, or up to 45 days, and not older.
for more details of how to analyze results at scale, please look at our How to Identify a Trend in Performance and its Causes guide, specifically on "Let's dive into results", in order to understand which results and activities are relevant for your decision making process across different measurements, channels and geos.
Here's how you can export the data:
When all measurements were done, export results, and analyze (the export button appears to the right)
A pro tip: Filter the results page to show your own measurements, and the day you’ve run all relevant results in. Read more about the table view here.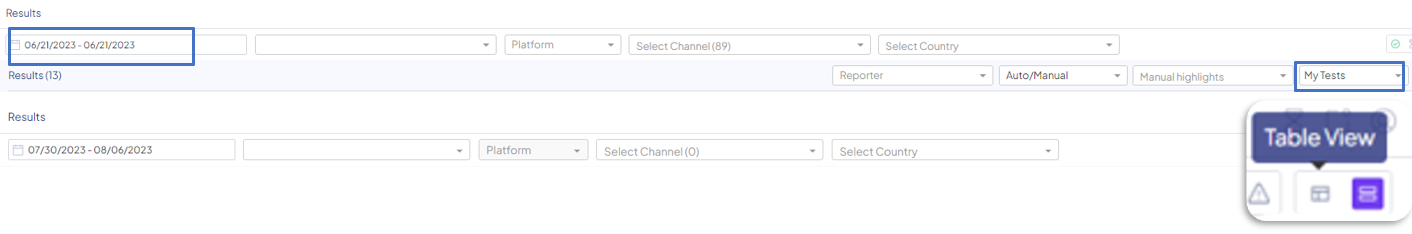
Compare to the set benchmarks
Benchmarks will help you compare the incremental value from a change in spend, to the expected (or average) CPI, CPA or ROAS.
Based on those, you can compare the incremental value from the result, and determine the recommended action to be taken.
For example, in the following measurement, we're seeing an increase in spend which exceeds the set ROAS benchmark. As such, this indicates a great incrementality from this campaign, which means we can increase its spend.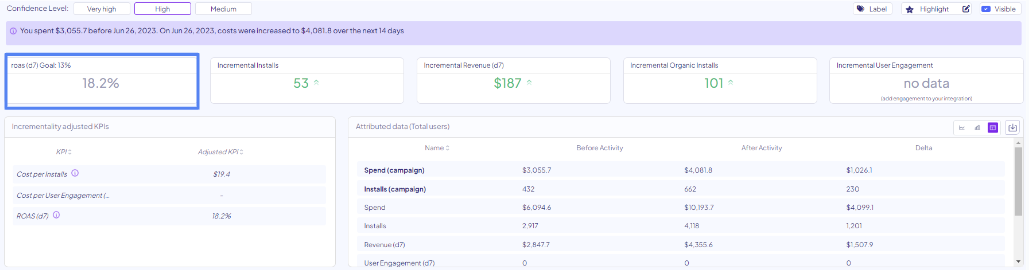
Tip: If your benchmark is based on attribution data, please note that even when the benchmark isn't reached, the incremental value you achieved can be great. For instance, if the benchmark is set to 30% ROAS, and you received 18% - This would be considered a decent incremental value.
The optimization and decision can be done based on your strategy.
For any question please contact support@incrmntal.com , or open a support Ticket here