Welcome to INCRMNTAL - Navigation
In this article you will learn about all the Dashboards available within Incrmntal's updated UI
INCRMNTAL contains a variety of views that could help you understand the true value of your marketing activities, from a market contribution standpoint.
It consists of several views and abilities, here are the main ones:
1. Perfromance Map
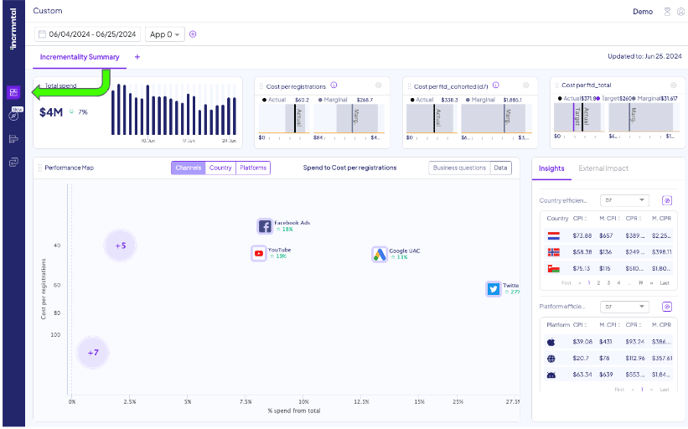
Performance Map is based on our Explorer product, and it consists of a high-level overview of all your channels, countries and platforms, from a
contribution and
marginal points of view.
This one is relevant for a quick read to your current market performance. You can use it by identifying top performers compared to spend level .
You can learn more about the Main Dashboard functionalities here.
2. INCRMNTAL Explorer
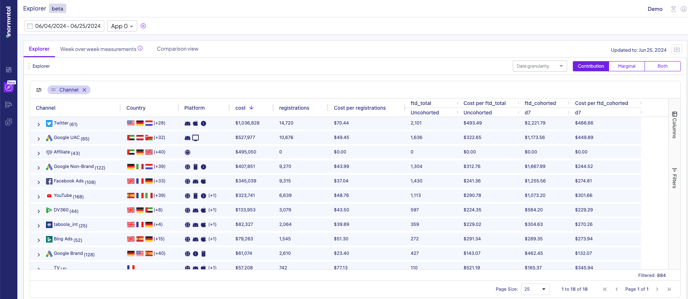
The Explorer can be accessed by clicking on the "compass" icon (second from the top).
INCRMNTAL Explorer is an entire section of the product by which you can understand the impact of your channel level performance, and drive budget allocation decisions. To assess the overall
Contribution of your channel to your Market
It consists of several representations of the same data points:
A Week over Week performance , a period over period
comparison as well as a
pivot table, with a lot more slice and dice options.
On the Pivot you are also able to account for your
Marginal performance.
You can learn more about the Explorer functionalities here.
3. INCRMNTAL Analyst: Analytics and Results
To access the Results and Analytics Dashboard click to the Results and Analytics graph button (third from the top)
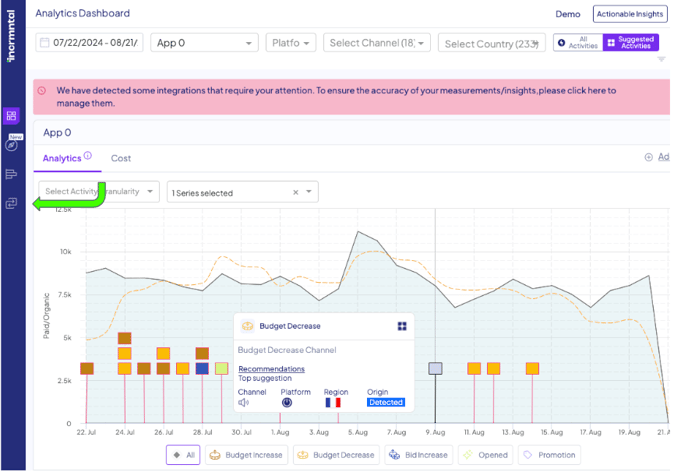
INCRNTAL Analyst Dashboard is our ultra-granular view of your marketing activities. It contains an ability to go into a specific change in spend, and measure it. The results will appear on the Results tab.
This view is usable in order to understand the impact of a specific change onto the market (i.e. total performance in an OS + Country), as well as measure External Events, such as your promotion, as well as understanding an impact of an App Featuring, for example.
Result Dashboard
After you have run measurements, they will be accessible in the Results Tab on the same “Results and Analytics” Dashboard
You can learn more about the Analytics and Results Dashboard functionalities here.
4. Configuration
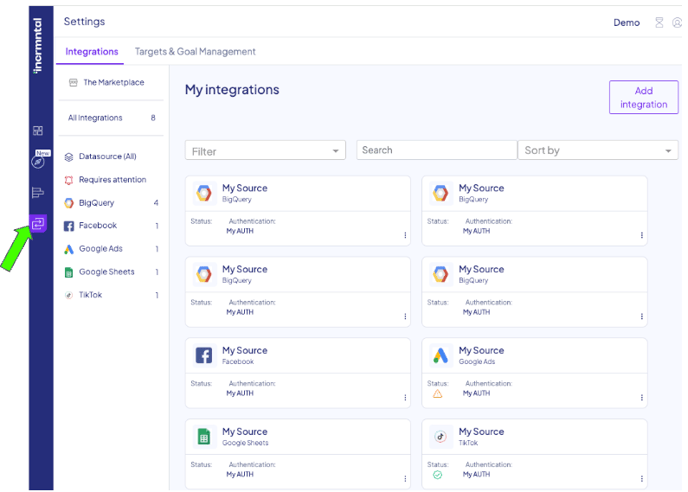
This is where you configure your authentications, spend and performance sources, as well as manage users and accounts.
For any question please contact onboarding@incrmntal.com , or open a support Ticket here