
This article explains how to identify a trend in your performance or spends, and understand the cause to it, based on the changes in your spend.
Have you noticed a decrease in performance over time in a certain geo?
Have you significantly increased or decreased your spend in one of your markets?
Through measurements in the relevant timeframe, country, and OS, we can identify the channels or campaigns that due to changes in their spends, might’ve reduced or increased the incrementality in your performance.
In the following example, we’ll demonstrate how we were able to identify the changes in spend that were beneficial for a KPI (CPI/CPA/ROAS) in a given country + OS, and the ones that weren't.
In case there were external changes or actions that might’ve impacted your KPIs (OOH campaigns, social posts, malfunction in your app, and so on), we highly recommend you to add those to the board before starting to measure the paid marketing changes within the relevant timeframe.
Read more about adding external activities to the dashboard and measuring them here.
How do we investigate?
- To identify the changes in campaigns’ spends in a given timeframe, OS, and country in the dashboard, we’d filter to this country and OS and filter through the channels, to understand the occurring changes. We'd suggest starting with your top spending country and channel.
Note: Turning off Suggested Activities will help you see all changes in spend.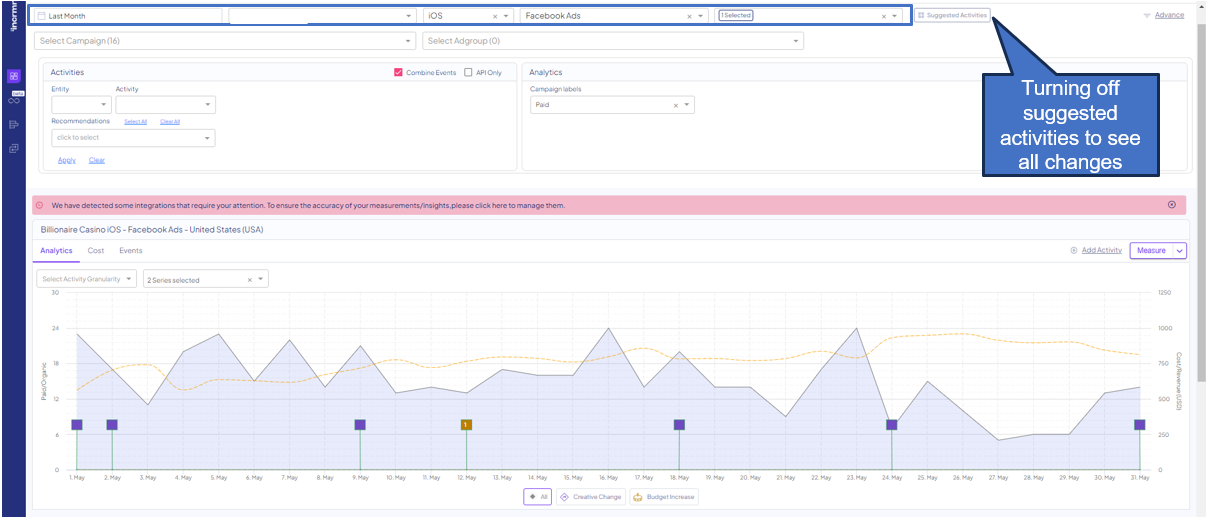
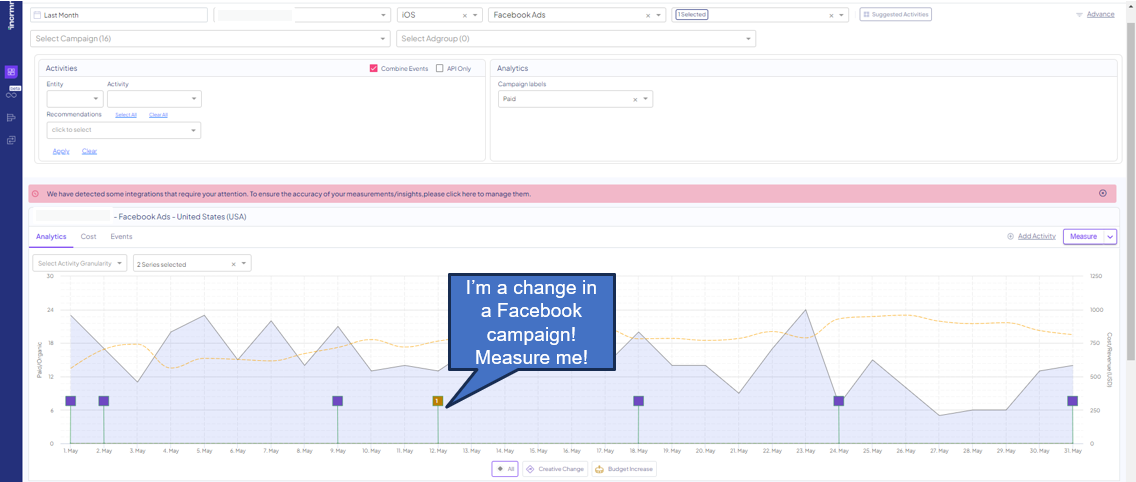
- Filtering to a specific campaign by choosing it from the table below. Identify the changes in spend, and measure for every campaign.
- When all measurements were done, export results, and analyze (the export button appears to the right)
A pro tip: Filter the results page to show your own measurements, and the day you’ve run all relevant results in. Read more about the table view here.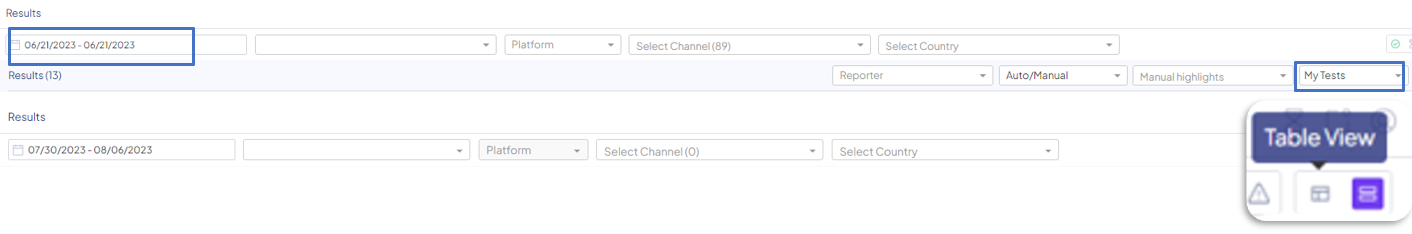
For your reference, attached are explanations on how to read, interpret, and make decisions based on a given result of a measurement you’ve run:
- How to Read Results - Simplified
- How to Read Results - Advanced
- How to Make Decisions based on Incrementality Measurements
Let's dive into results
- Once exported, you'll be able to see the following fields in your export:
-
Activity Date
- Measured Media source, channel, campaign, and ad group
-
Type of activity
-
Platform
- Country
- Spend and KPIs, before and after the change, as well as deltas. Those will be included both for the entity (installs and spend) and the country+OS in which the measured activity happened in, for the same timeframe.
- Incremental values for KPIs
- Cohorts
-
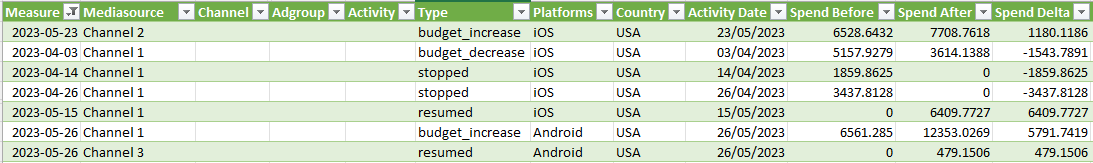
- In the following pivot table, we’ve chosen to present the spend of the entity, the spend delta (=change in spend), the relevant cohort, and the incremental installs.
We also added a calculation of the ROAS, CPA, and CPI.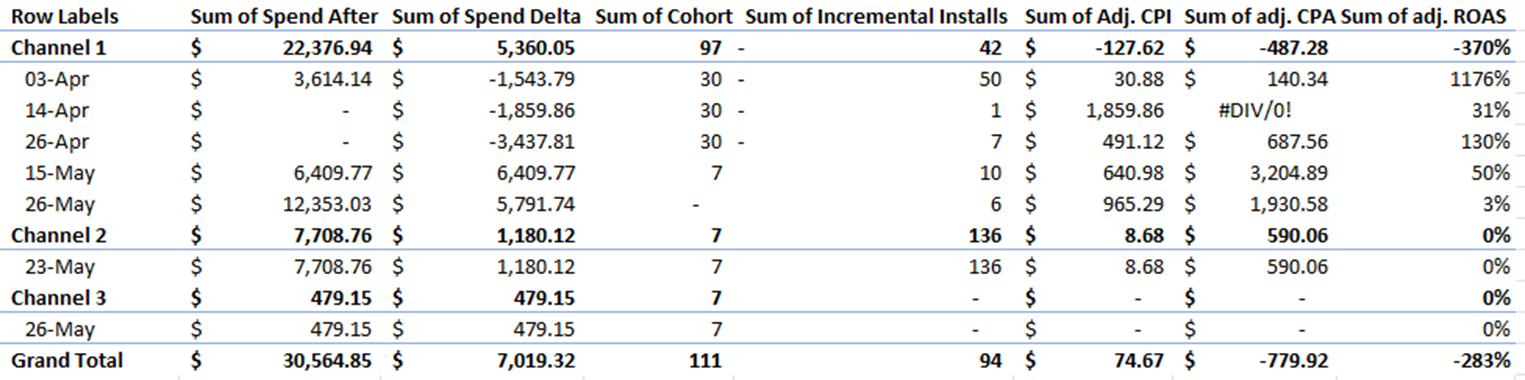
- We can see, that as a result of decreasing Channel 1’s spend, we’ve lost a significant amount of ROAS, which indicates this channel is incremental for our revenues.
In the same manner, we see that when we’ve increased the spend for Channel 2 and 3, we haven’t detected a lift in the gained incremental revenue.
The bottom line here would be that Channel 1 is an incremental channel, while Channel 2 and Channel 3 are not.
With every analysis, consider your own benchmarks for CPI, CPA, or ROAS, depending on your strategy.
The export of results is also available via an active gSheet, which is updated on a weekly basis. You can read further about it here, and contact your dedicated CSM for a definition and setup.
For any question please contact support@incrmntal.com , or open a support Ticket here